Air quality data from several government monitoring stations in Delhi went missing for hours during the pollution spike following Deepavali on Sunday (November 8, 2026), with experts warning that the gaps have led to understated pollution levels and resulted in a lower official air quality index (AQI).
According to Dr. D. Saha, former head of the Central Pollution Control Board (CPCB)’s air quality laboratory, AQI values are calculated using a moving or running average of hourly concentrations of eight parameters, including PM2.5 and PM10, over the previous 24 hours.
On Monday (November 9, 2026), PM2.5 data were missing for several hours at many stations in the city, including Anand Vihar, Patparganj and Bawana, on the CPCB website. PM2.5 (particulate matter measuring 2.5 micrometres or less in diameter) consists of fine inhalable particles that can penetrate the lungs and enter the bloodstream, causing respiratory and other diseases. Similar data gaps were reported at several monitoring stations during Deepavali last year as well.
CPCB data
‘Artificial AQI’
Manoj Kumar, an analyst at the Centre for Research on Energy and Clean Air (CREA), a Finland-based non-profit research organisation, said the missing hourly PM2.5 data “raised concerns about the assessment of Delhi’s air quality”.
“From midnight on November 8 until 5 a.m. on November 9, 227 hourly PM2.5 observations were missing across 59 CPCB monitoring stations in Delhi. Only 14 stations reported complete data, while the remaining 45 had at least one missing hourly observation,” Mr. Kumar said, adding, “When the hourly PM2.5 data is missing, it will artificially lower the AQI, showing better air quality when the actual air quality is worse.”
CPCB data
When asked about the missing air quality data at several monitoring stations, Delhi Labour Minister Kapil Mishra told the media that the government would look into the issue. The Member Secretary of the CPCB, which releases AQI data, did not respond to calls and messages seeking comment.
Dr. Saha told The Hindu that there should not be gaps in the data, especially during crucial periods.
“If hourly PM2.5 or PM10 value is blank or missing, it will affect the AQI calculated and the final value of the AQI calculated will be less than the actual value of AQI and scientifically incorrect,” Mr. Saha said.
He also said the CPCB had set the measurement range of PM2.5 analysers at 0–1,000 micrograms per cubic metre, which meant they could not measure concentrations above that level. “So, if the value of PM2.5 is beyond 1,000, it should at least be shown as 1,000 instead of showing blank,” he said.
A former DPCC scientist, who did not wish to be identified, said the CPCB recorded PM2.5 values only up to 1,000 micrograms per cubic metre because there was a minor drop in accuracy at higher levels. “But at very high values, a small drop in accuracy will not matter a lot. Ideally, the CPCB should be measuring the higher values so that we are not missing the peak values,” the official said, adding that not measuring higher concentrations would artificially make air quality appear better.
‘Missing peak pollution’
Bhavreen Kandhari, an environmental activist, alleged that the government was clearly fudging the data to conceal the actual air pollution situation rather than solving the problem.
Post-Deepavali smog envelopes cities as air quality plummets to ‘severe’ | In pictures
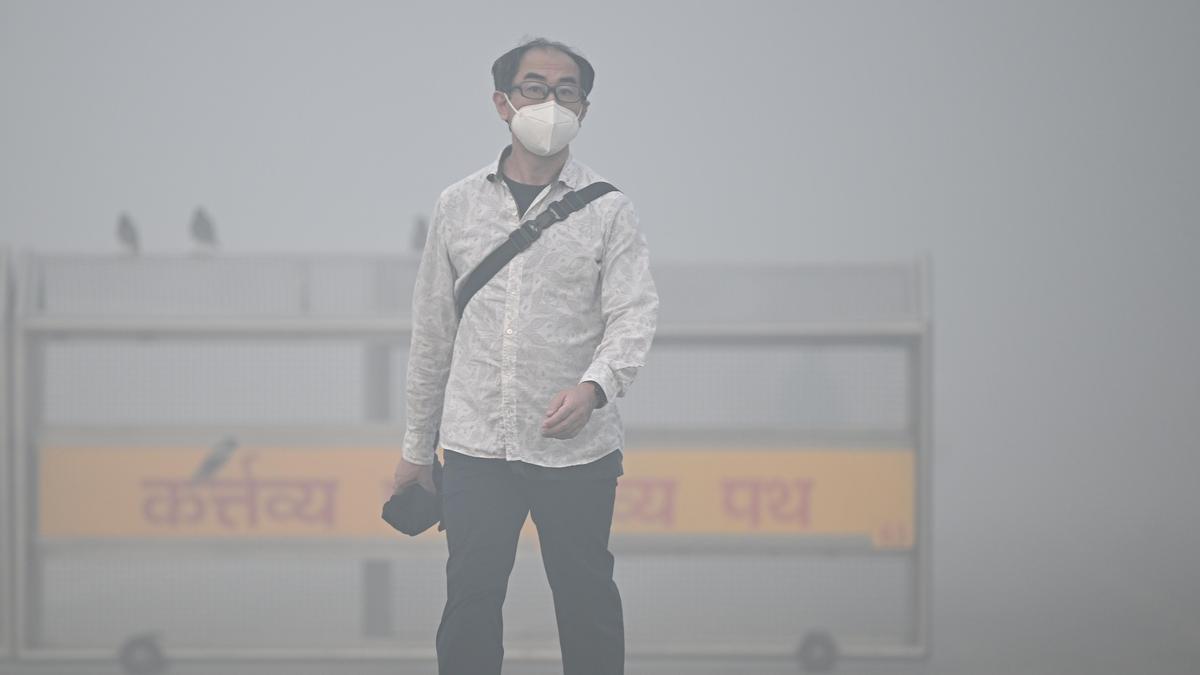
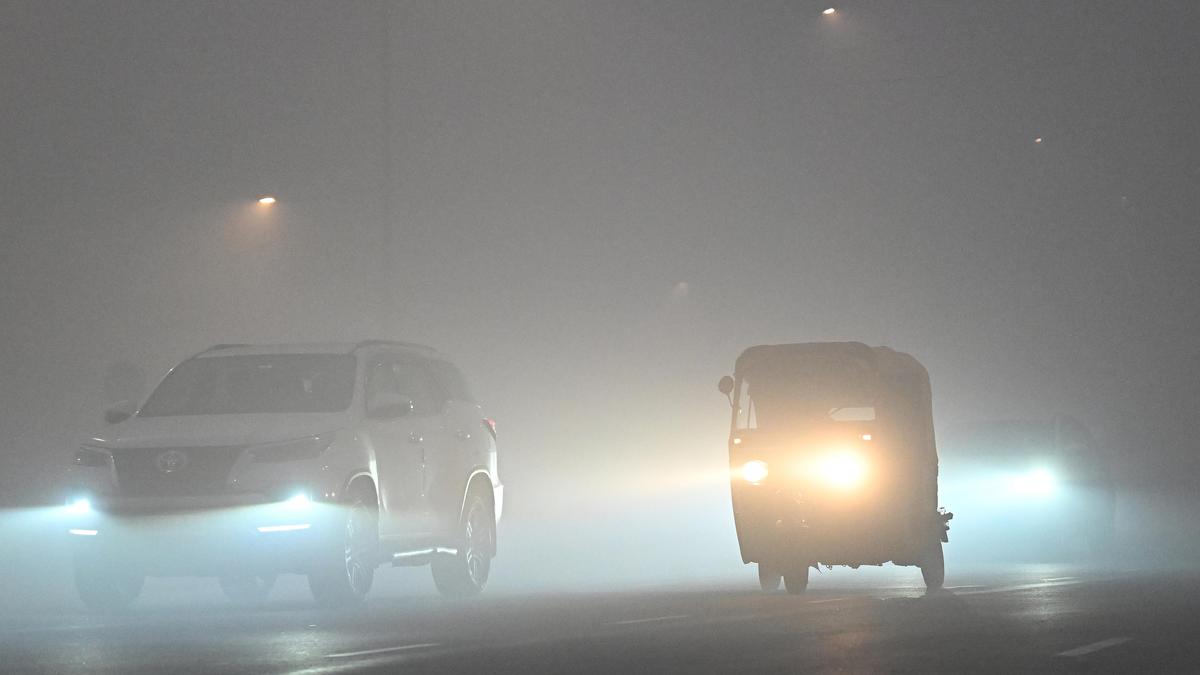
A thick layer of toxic haze engulfs Delhi as people commute near Rashtrapati Bhavan, shrouded in thick smog during the early morning of November 9, 2026, a day after Deepavali. The city’s 24-hour average AQI was 370, in the “very poor” category, at 9 a.m.
People jog near India Gate, shrouded in thick smog, as Delhi’s AQI touched 404 in the ‘severe’ category at 4 a.m. on November 9, 2026, according to the CPCB’s live dashboard.
Burari Crossing recorded Delhi’s highest AQI on November 9, 2026, at 441, followed by Vivek Vihar at 437 and Delhi Technological University at 434. People walking near India Gate.
Stage III of the Graded Response Action Plan (GRAP) is in force across Delhi and adjoining districts of Haryana, Uttar Pradesh and Rajasthan, following the CAQM’s decision. A view of the Rashtrapati Bhavan, shrouded in thick smog during the early morning hours after Deepavali night.
The Supreme Court had allowed only green firecrackers in specified time windows on November 7 and 8, 2026, but the more polluting traditional crackers were also available in Delhi markets.
People commute near Rashtrapati Bhavan, shrouded in thick smog. PM2.5 refers to fine inhalable particles 2.5 micrometres or smaller, which can enter deep into the lungs and the bloodstream and cause respiratory and other health problems.
Kherwadi-Bandra East in Mumbai recorded an AQI of 264 on November 9, 2026, followed by Sewri at 226, Ghatkopar at 221 and Chembur at 216.
Byculla recorded an AQI of 193, Mindspace-Malad West 191, Kandivali West 187 and Worli 148 in Mumbai on November 9. Kurla was the lowest at 96.
Chennai’s AQI slipped to the ‘poor’ category at 213 on the morning of November 9, 2026, according to the CPCB’s Sameer app.
A private sensor at the Chennai home of weather blogger K. Srikanth recorded an AQI of around 1,000 for nearly four hours between 6 p.m. and 10 p.m. on November 8, 2026. Chennai residents said smoke from firecrackers lingered in cramped residential communities, with visibility so poor at one point that people could barely see one another.
As of 9 a.m. on November 9, 2026, Manali Village recorded Chennai’s highest AQI at 296, followed by Arumbakkam at 265, Kodungaiyur at 215, Royapuram at 184 and Velachery Residential Area at 142.
Hyderabad woke up to a grey, smoggy morning on November 9, 2026, after Deepavali celebrations that went on until 3 a.m. in localities such as Banjara Hills, Panjagutta, S.R. Nagar, Ameerpet and Somajiguda.
Smog shrouds the historic Golconda Fort. PM2.5 in Hyderabad reached 392 μg/m³ at 9.30 p.m. on November 8, 2026, with the city’s AQI averaging 509.
Ravi Colony near Masjid Banda in Hyderabad logged an AQI of 995 on November 8, 2026, and Serilingampally recorded 666 at 11.30 p.m., when the city average was 442.
Telangana Pollution Control Board monitors in Hyderabad were out of order as pollution rose on November 8, 2026, with the University of Hyderabad station offline by 10 p.m. The figures come from publicly available monitors. Hyderabad’s AQI was still 178 on November 9, morning, with PM10 at 113 μg/m³.
A vendor walks amid a thick layer of smog, near Sangam in Prayagraj, Uttar Pradesh. Lucknow (251), Amritsar (242), Jodhpur (234), Ahmedabad (230), Dehradun (228), Jaipur and Udaipur (223 each), Surat (207), Nagpur (239), Pune (221) and Bhopal (205) also recorded ‘poor’ air quality on November 9, 2026.
1/3
On the CPCB website, PM2.5 readings appeared to be capped at 1,000 micrograms per cubic metre across all stations, with data missing for several hours at multiple locations.
According to CPCB data, PM2.5 concentration in Anand Vihar spiked to 767 micrograms per cubic metre at 11 p.m. on Sunday (November 8, 2026), about 51.13 times the World Health Organization’s (WHO) 24-hour guideline of 15 micrograms per cubic metre. However, readings were missing for the next three hours, while PM10 data were unavailable for five hours.
Hourly PM2.5 concentrations across Delhi.
| Photo Credit:
CREA
Similarly, PM2.5 concentration in Patparganj, east Delhi, peaked at 930 micrograms per cubic metre at 10 p.m. on Sunday (November 8, 2026), about 62 times the WHO’s guideline, before readings went missing for three hours. CPCB data also showed that PM10 readings were missing for seven hours at the station.
Mr. Kumar said Siri Fort in south Delhi recorded a PM2.5 concentration of 1,000 micrograms per cubic metre. “The portal does not display readings above this level, raising concerns about the representation of extreme pollution concentrations,” he said.
Published – November 09, 2026 05:19 pm IST