
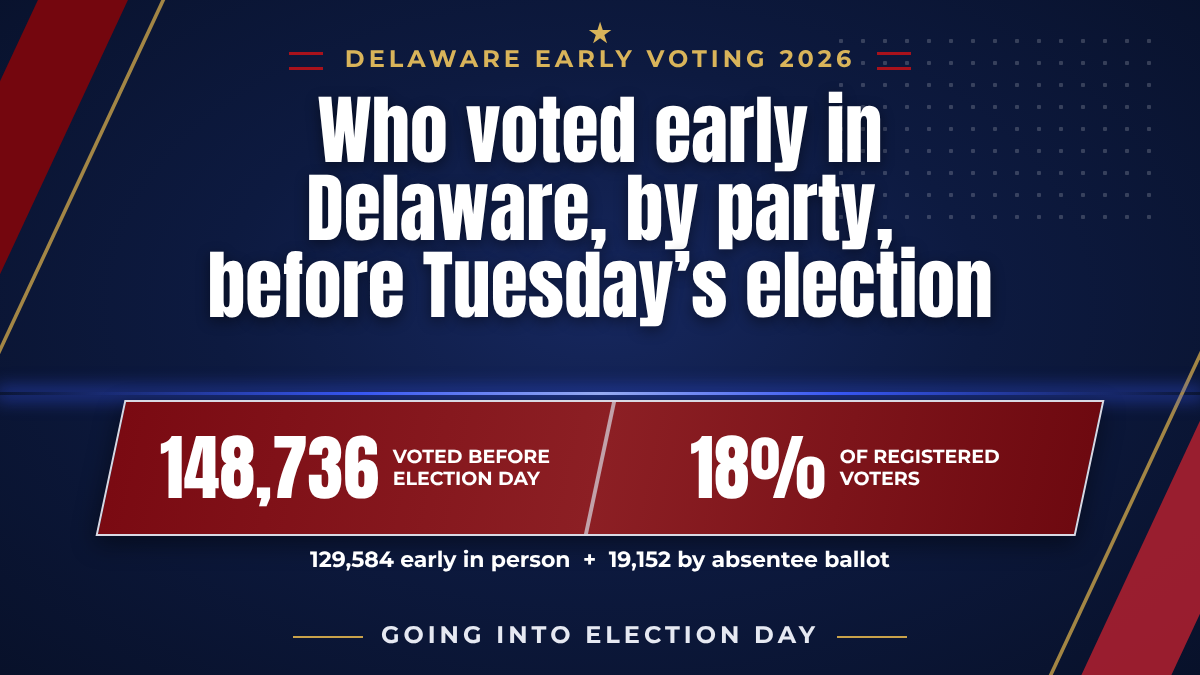
DOVER, Del. — More than 148,000 Delawareans have already voted heading into Election Day on Tuesday, Nov. 3, according to the Delaware Department of Elections’ Election Voted List, obtained by Delaware LIVE.
That’s 148,736 people, or 18% of the state’s 809,631 registered voters. Most of them, 129,584, voted early in person before early voting ended at 7 p.m. Sunday. Another 19,152 voted by absentee ballot.
That’s nearly double the 10% who voted early or by absentee ballot in the 2022 midterm, according to the state’s official results and registration totals. Figure 1 shows the full breakdown.
The total is up just 3,026 from late Sunday afternoon, when Delaware LIVE published its seven races to watch, and the party mix has barely changed. Party here means how voters are registered, not who they voted for.
Figure 1:Where Delaware stands going into Election Day
Voters counted as of Monday afternoon, Nov. 2. Registered voters as of Nov. 1, according to the Department of Elections.
148,736
people have already voted18% of Delaware’s 809,631 registered voters
That total is made up of:
129,584
voted early in person16% of registered voters
19,152
voted by absentee ballot2% of registered voters
Voted before Election Day: 2022 vs. 2026
Who has voted so far, by party registration
78,754
registered Democrats have voted24% of all registered Democrats
41,148
registered Republicans have voted21% of all registered Republicans
28,834
everyone else who has voted10% of all other registered voters
How early voting played out, day by day
Figure 2:In-person early voters each dayBy party registration, Oct. 22 to Nov. 1, 2026. The percentages show each party’s share of that day’s early voters.
Registered DemocratsRegistered RepublicansEveryone else
Open 12 hours a day (7 a.m. to 7 p.m.)
ThuOct. 22
Dem. 56% · Rep. 27% · Everyone else 17%
FriOct. 23
Dem. 51% · Rep. 30% · Everyone else 19%
SatOct. 24
Dem. 55% · Rep. 27% · Everyone else 18%
SunOct. 25
No early voting
MonOct. 26
Dem. 51% · Rep. 30% · Everyone else 19%
TueOct. 27
Dem. 49% · Rep. 31% · Everyone else 19%
Open 8 hours a day (11 a.m. to 7 p.m.)
WedOct. 28
Dem. 50% · Rep. 30% · Everyone else 20%
ThuOct. 29
Dem. 49% · Rep. 30% · Everyone else 21%
FriOct. 30
Dem. 49% · Rep. 29% · Everyone else 22%
SatOct. 31
Dem. 49% · Rep. 28% · Everyone else 23%
SunNov. 1
Dem. 50% · Rep. 27% · Everyone else 23%
Where the seven races stand
Swipe sideways to see all columns →
Table 1:Delaware LIVE’s seven races to watchEarly and absentee voters as of Monday afternoon, Nov. 2, by party registration, not how they voted. Smaller numbers are each party’s registered voters.
Seat
On the Nov. 3 ballot
Who has voted so far, by party registration
Registered Democrats
Registered Republicans
Everyone else
State treasurer
Statewide
Colleen Davis, not running
Ted Lauzen (D)
Mike Ramone (R)
78,754
of 333,488
41,148
of 199,294
28,834
of 276,849
Senate District 15
Kent
Dave Lawson, retiring after 16 years
Nisha Lodhavia (D)
Emily A. Thompson (R)
2,530
of 11,190
2,426
of 14,259
1,229
of 14,900
House District 4
Sussex
Jeff Hilovsky, retiring after 4 years
Gregg Lindner (D)
Dan Zitofsky (R)
4,214
of 8,328
3,818
of 9,617
2,237
of 9,135
House District 33
Kent
Charles S. Postles Jr., retiring after 10 years
Joshua Pennington (D)
Morgan Hudson (R)
1,536
of 6,154
1,357
of 6,467
833
of 7,335
House District 38
Sussex
Ronald E. Gray, retiring after 14 years
Maureen Madden (D)
Carlie Carey (R)
4,463
of 7,499
5,573
of 11,526
2,670
of 8,305
House District 41
Sussex
Richard G. Collins, retiring after 12 years
Ryan Stuckey (D)
John Atkins (R)
2,023
of 6,544
2,334
of 9,239
1,044
of 7,761
New Castle County Council, District 3
New Castle
Janet Kilpatrick, retiring after 16 years
Kira Alejandro (D)
Melissa S. Brayman (R)
3,168
1,231
1,209
(Note: Statewide totals count every voter on the list once. Delaware LIVE’s Sunday article added up the 21 Senate districts instead, which left out 537 voters with no Senate district on the list, so its statewide numbers were lower. Registered voters are as of Nov. 1. Registration totals by county council district are not published in the state’s reports. Source: Election Voted List, obtained by Delaware LIVE [Nov. 2, 2026].)
Turnout by county and district
Table 2:Early and absentee voters by countyBy party registration. The smaller numbers show each share of the county’s registered voters, overall and by party.
County
Voted
Dem.
Rep.
Everyone else
New Castle
59,16913% of 441,080
38,82118% of party
9,68012% of party
10,6687% of party
Kent
23,11216% of 148,242
11,90522% of party
6,65017% of party
4,5578% of party
Sussex
66,45530% of 220,309
28,02841% of party
24,81832% of party
13,60919% of party
▼ Show Table 3: all 41 state House districts▲ Hide Table 3
Swipe sideways on the table to see all columns →
Table 3:Early and absentee voters by state House districtBy party registration. The smaller number is the share of that party’s registered voters in the district. ★ marks one of Delaware LIVE’s seven races to watch.
District
County
Dem.
Rep.
Everyone else
More voters, by count
1
New Castle
2,23918% of party
11210% of party
2545% of party
Democrats
2
New Castle
1,42313% of party
887% of party
2965% of party
Democrats
3
New Castle
1,05811% of party
786% of party
1362% of party
Democrats
4 ★
Sussex
4,21451% of party
3,81840% of party
2,23724% of party
Democrats
5
New Castle
1,61116% of party
19911% of party
2665% of party
Democrats
6
New Castle
2,15625% of party
54313% of party
59610% of party
Democrats
7
New Castle
1,91623% of party
42414% of party
4748% of party
Democrats
8
New Castle
2,47826% of party
80418% of party
77010% of party
Democrats
9
New Castle
3,04829% of party
1,14720% of party
1,13014% of party
Democrats
10
New Castle
1,93625% of party
66214% of party
61610% of party
Democrats
11
Kent and New Castle
1,03318% of party
78612% of party
4436% of party
Democrats
12
New Castle
2,43825% of party
69912% of party
75111% of party
Democrats
13
New Castle
80510% of party
1896% of party
2564% of party
Democrats
14
Sussex
5,39756% of party
2,28235% of party
1,82926% of party
Democrats
15
New Castle
1,87919% of party
36911% of party
4166% of party
Democrats
16
New Castle
1,49214% of party
1326% of party
2364% of party
Democrats
17
New Castle
1,55716% of party
28110% of party
3095% of party
Democrats
18
New Castle
1,29415% of party
2098% of party
3335% of party
Democrats
19
New Castle
1,02213% of party
3248% of party
3355% of party
Democrats
20
Sussex
4,83156% of party
3,07840% of party
2,20129% of party
Democrats
21
New Castle
1,37318% of party
43110% of party
5048% of party
Democrats
22
New Castle
1,55520% of party
64911% of party
6289% of party
Democrats
23
New Castle
1,59124% of party
51114% of party
55210% of party
Democrats
24
New Castle
1,18915% of party
2879% of party
3926% of party
Democrats
25
New Castle
1,19718% of party
28310% of party
3647% of party
Democrats
26
New Castle
1,23415% of party
22411% of party
2765% of party
Democrats
27
New Castle
1,67519% of party
68714% of party
5468% of party
Democrats
28
Kent and New Castle
1,45317% of party
53813% of party
4296% of party
Democrats
29
Kent
2,46925% of party
91618% of party
78810% of party
Democrats
30
Kent
1,02220% of party
1,39518% of party
5597% of party
Republicans
31
Kent
2,02725% of party
55420% of party
5469% of party
Democrats
32
Kent
1,09616% of party
36012% of party
3826% of party
Democrats
33 ★
Kent
1,53625% of party
1,35721% of party
83311% of party
Democrats
34
Kent
1,92425% of party
1,09219% of party
80910% of party
Democrats
35
Sussex
1,16821% of party
1,26917% of party
5288% of party
Republicans
36
Sussex
1,78628% of party
1,69225% of party
87712% of party
Democrats
37
Sussex
2,21838% of party
1,97131% of party
1,19619% of party
Democrats
38 ★
Sussex
4,46360% of party
5,57348% of party
2,67032% of party
Republicans
39
Sussex
98419% of party
1,30322% of party
5709% of party
Republicans
40
Sussex
94420% of party
1,49819% of party
4577% of party
Republicans
41 ★
Sussex
2,02331% of party
2,33425% of party
1,04413% of party
Republicans
▼ Show Table 4: all 21 state Senate districts▲ Hide Table 4
Swipe sideways on the table to see all columns →
Table 4:Early and absentee voters by state Senate districtBy party registration. The smaller number is the share of that party’s registered voters in the district. Only 11 Senate seats are on Tuesday’s ballot. ★ marks one of Delaware LIVE’s seven races to watch.
District
County
Dem.
Rep.
Everyone else
More voters, by count
1
New Castle
4,68224% of party
80813% of party
9949% of party
Democrats
2
New Castle
2,84914% of party
1856% of party
3453% of party
Democrats
3
New Castle
1,87710% of party
1566% of party
3283% of party
Democrats
4
New Castle
3,02621% of party
1,05810% of party
1,1349% of party
Democrats
5
New Castle
3,72823% of party
1,07813% of party
1,0929% of party
Democrats
6
Sussex
10,84656% of party
5,73938% of party
4,37928% of party
Democrats
7
New Castle
1,87613% of party
5938% of party
6415% of party
Democrats
8
New Castle
2,64623% of party
86613% of party
93510% of party
Democrats
9
New Castle
2,10215% of party
5759% of party
7476% of party
Democrats
10
New Castle
4,48825% of party
1,62218% of party
1,50511% of party
Democrats
11
New Castle
2,66615% of party
53210% of party
6385% of party
Democrats
12
New Castle
4,23922% of party
1,11114% of party
1,2059% of party
Democrats
13
New Castle
3,08916% of party
4259% of party
5645% of party
Democrats
14
Kent and New Castle
3,56120% of party
1,35714% of party
1,0847% of party
Democrats
15 ★
Kent
2,53023% of party
2,42617% of party
1,2298% of party
Democrats
16
Kent
3,21624% of party
2,05119% of party
1,47110% of party
Democrats
17
Kent
3,58322% of party
1,17919% of party
1,0628% of party
Democrats
18
Sussex and Kent
2,77623% of party
2,84620% of party
1,36110% of party
Republicans
19
Sussex
5,95442% of party
5,43334% of party
3,06720% of party
Democrats
20
Sussex
6,66248% of party
8,12841% of party
3,90125% of party
Republicans
21
Sussex
1,95319% of party
2,94820% of party
1,0388% of party
Republicans
(Note: This table leaves out 551 voters who have no Senate district on the list. They live in House Districts 2, 31 and 41 and are counted in Tables 2 and 3. Sources: Election Voted List, obtained by Delaware LIVE [Nov. 2, 2026]; Delaware Department of Elections, Voter Registration Totals by Senate District [Nov. 1, 2026].)
Before you vote
Polls are open Tuesday, Nov. 3, from 7 a.m. to 8 p.m. You vote at your own polling place. Delaware LIVE’s 2026 Voters Guide has your polling place and every name on your ballot. It will also have election results Tuesday night.